My World of Moisture

Tag: Moisture Page 1 of 4

Understanding Deliquescence

I recently posted on LinkedIn about a favourite subject of mine, deliquescence. You may think this is a bit weird to have enjoyment in such thing, but it simply fascinates me from all sorts of angles.

Deliquescence – What Is It?

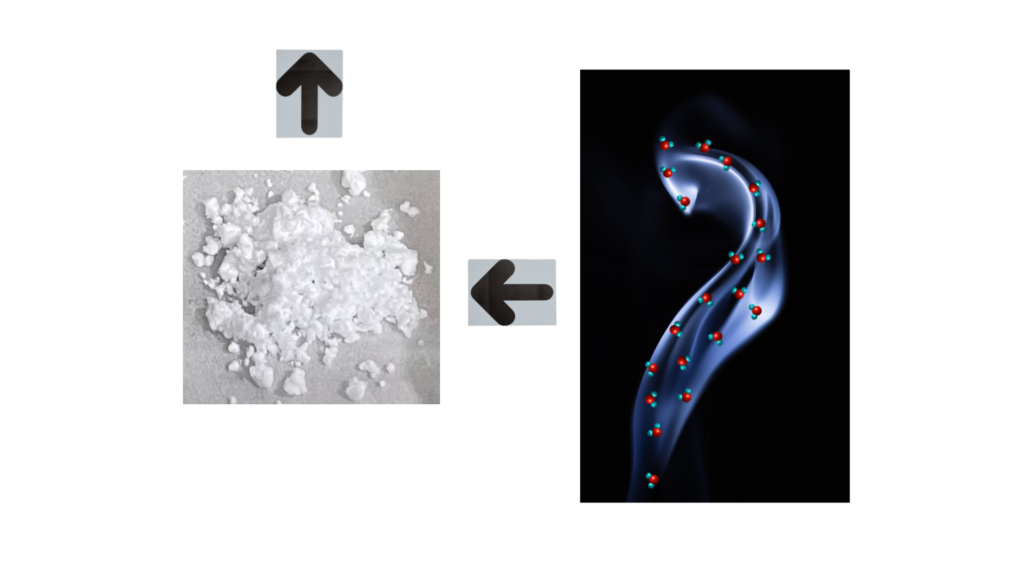
To begin with, deliquescence is a perfectly natural process in some materials that adsorb moisture. There is a natural tendency for materials to adsorb and release moisture depending on the surrounding relative humidity (%RH). Some materials that have a high solubility in water adsorb moisture from the air and the molecules at the surface dissolve in this moisture. As more moisture is adsorbed, more of the material dissolves and this can continue until all the material turns into a liquid solution of the substance.

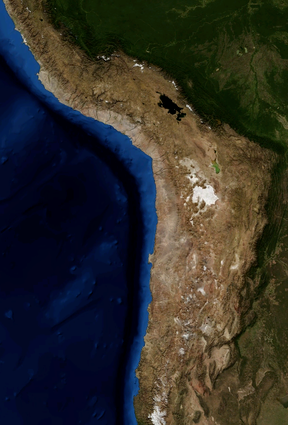
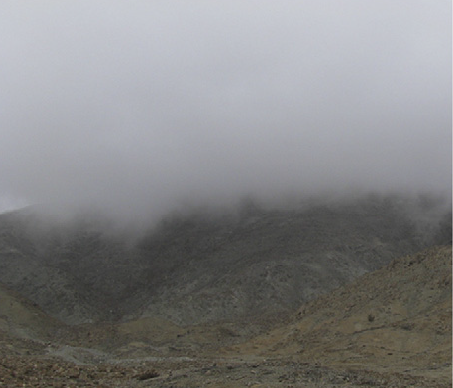
In Nature this phenomenon is exploited by some organisms for their survival. House mites will only thrive above a certain level of humidity and that is determined by deliquescence of a Na and K salt combination and the liquid draining into the mouth of the mite. The Atacama Desert, located in northern Chile, is accepted as being the driest and oldest part of our planet. Microbiologists have studied the bacteria and fungi from this region since the 1960’s. One area of scientific research has been studies on microorganisms in halite crustal deposits in evaporated lakes and salts within rocks where moisture can penetrate. Deliquescence of these salts is transient occurring when moist air from the Pacific Ocean is carried in land, but sufficient to provide a source of water for microorganisms.

Rock Salt – An Unexpected Discovery

So how can we use this phenomenon of deliquescence in practical ways? Let us take a look at what happens to rock salt. In this example a candle holder made from rock salt, but this is also applies to rock salt lamps. Compositional analysis of the well-known Pink Himalaya Rock Salt shows it to be about 38.6% sodium. A quick chemical calculation tells us that NaCl is made up of 39.3% sodium. The difference in rock salt from pure NaCl is less than 1% of other minerals.

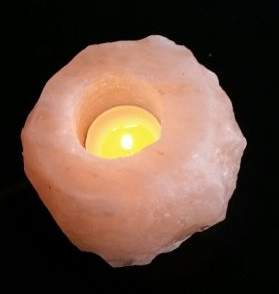
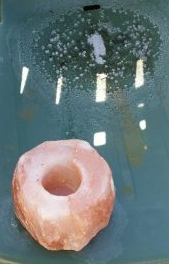
A Christmas present of two rock candle holders were left sitting on a glass table. They both ended up surrounded by a clear liquid. It took several sheets of kitchen roll to mop up these little pools. Magically this liquid seemed to have appeared out of thin air! 

The truth is that it did come out the air, but not by magic. A saturated solution of NaCl is accepted by IUPAC as a standard for 75 %RH with which to calibrate humidity instruments. However, 75 %RH is also the humidity at which solid NaCl begins to adsorb moisture from the air.

Application Of Knowledge

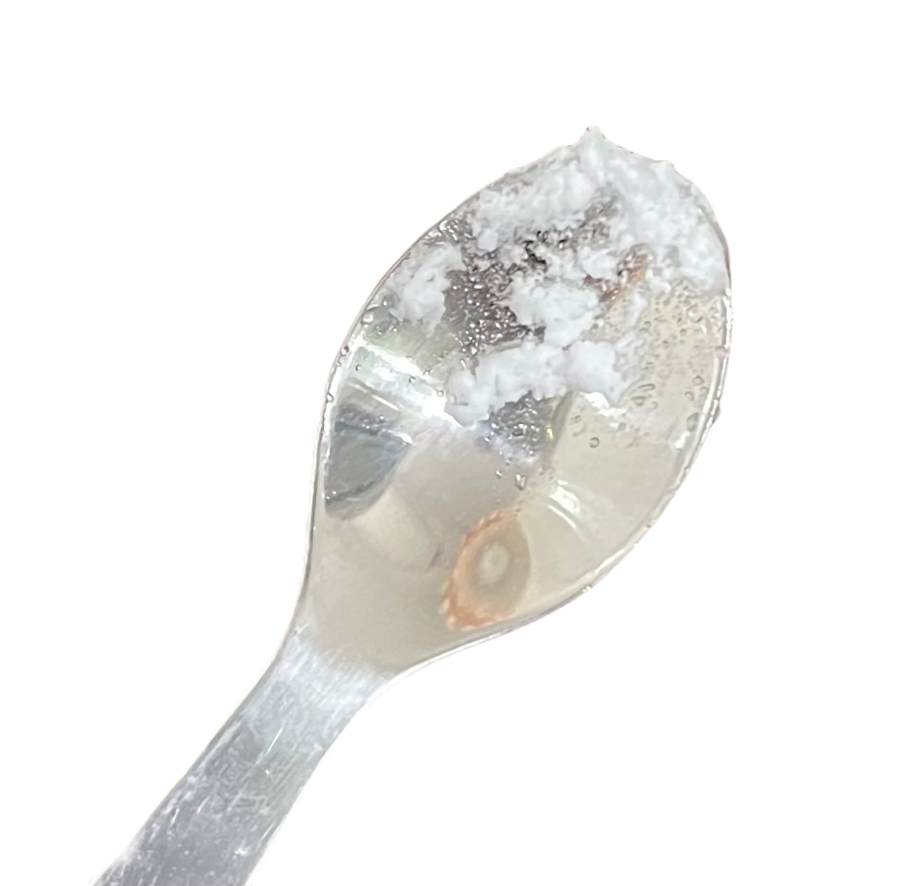
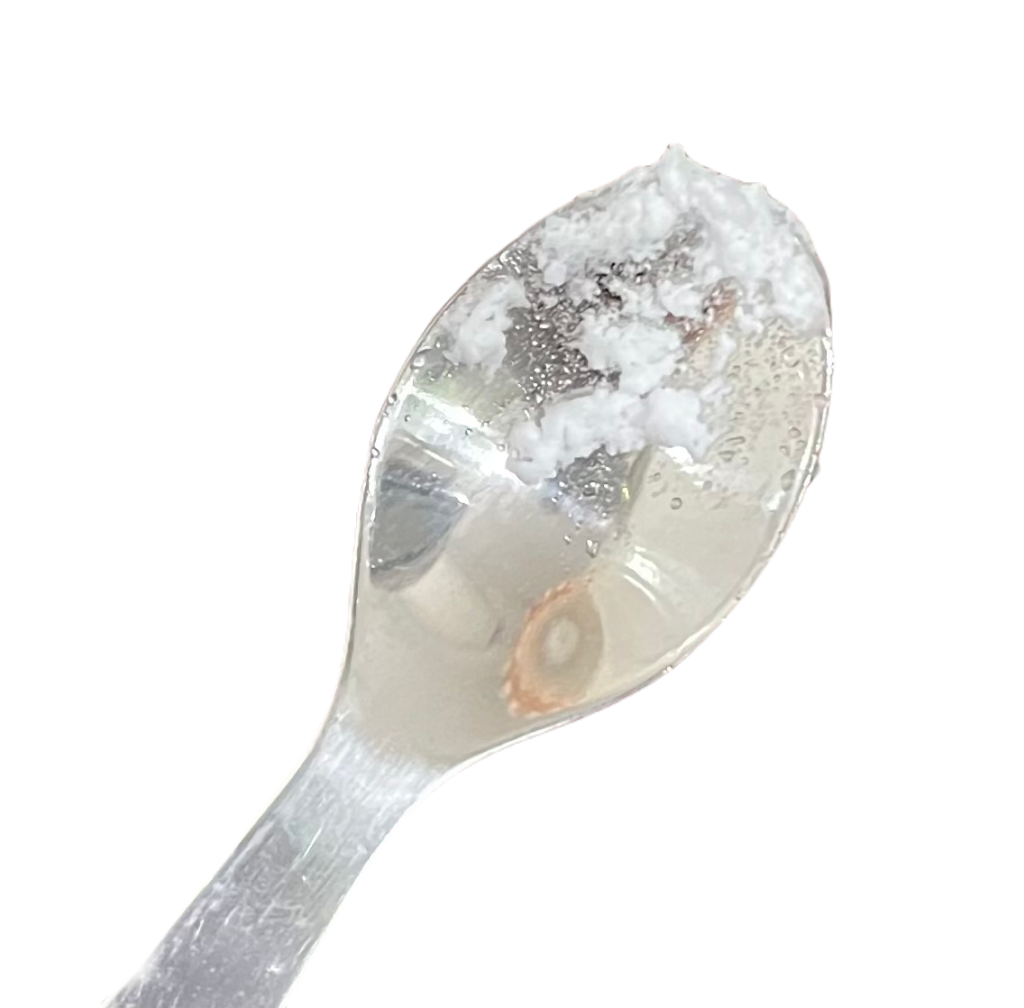
The outside humidity was quite high, so a practical experiment was performed. I left the salt candle holder outside on a plastic chair for a few of days when there was no rain forecast. In the photo you can see the liquid produced from running off the candle holder. At the edges and within the liquid are white spots from the salt recrystallizing as water then evaporates. The same effect happens at salt lakes and hot salt springs that gives the salt deposits that the candle holder was probably made from in the first place. For this to occur with the salt candle holder the outside humidity would have to be above 75%.

The Relative Humidity of Deliquescence

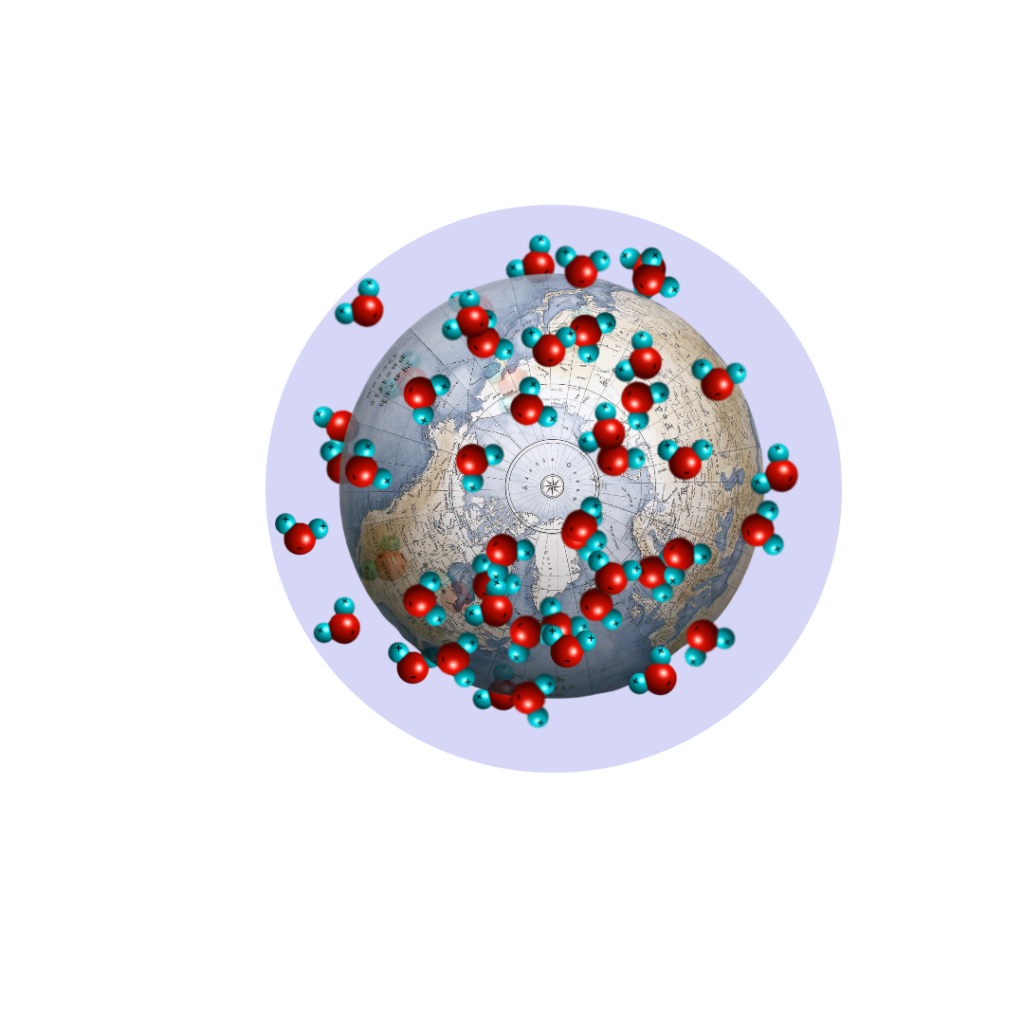
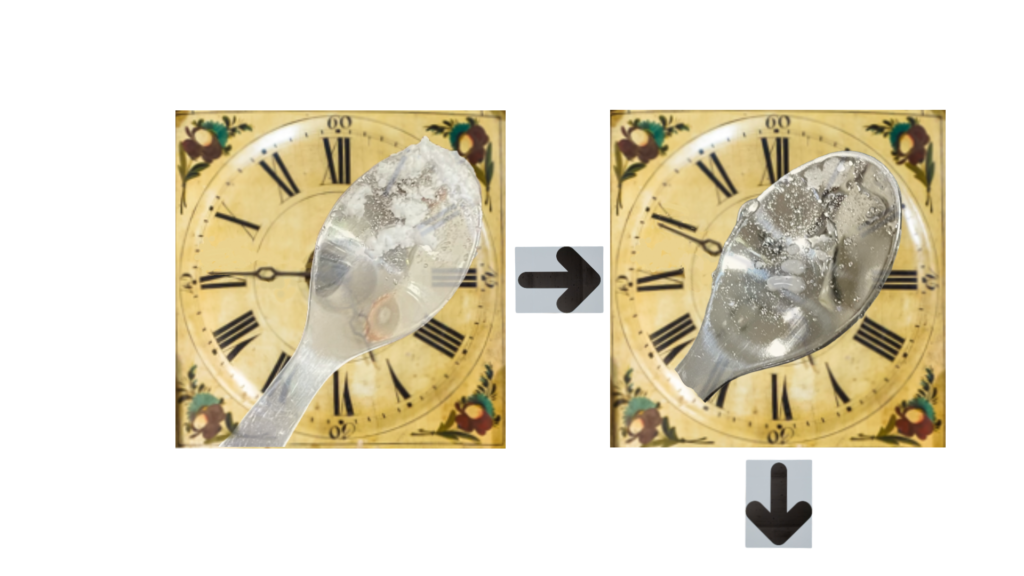
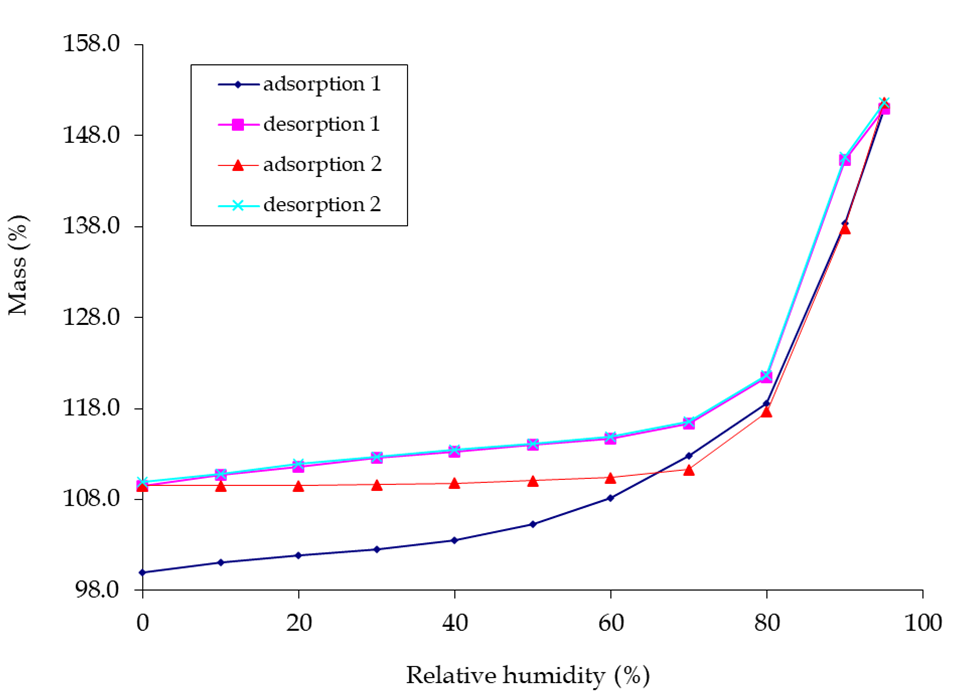
Observing the deliquescence in the lead photo, would you not like to know at what humidity this was going to occur? One technique for obtaining this information is Dynamic Vapour Sorption (DVS). This technique is generally regarded as the ‘gold standard’ for moisture studies. Performed at constant temperature, a moisture sorption isotherm of your API undergoing deliquescence may appear as a material with little or no weight gain and then show an inflection at a particular relative humidity.

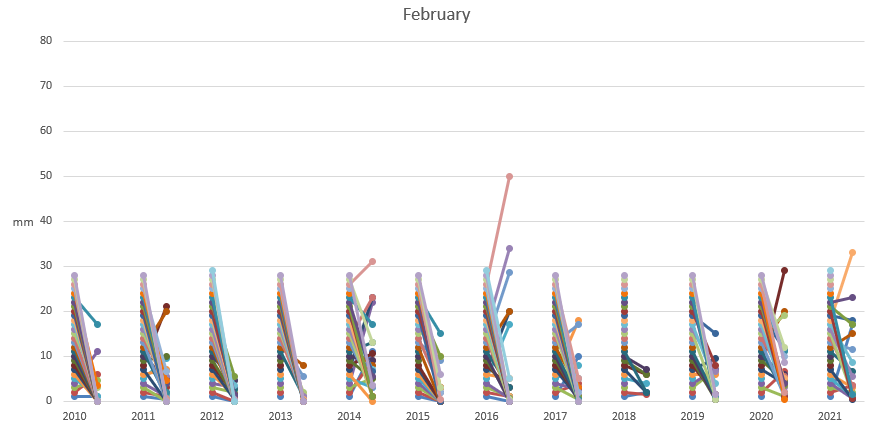
I was kindly granted permission to use the picture below of DVS graphs, known as moisture isotherms. Weight gain and loss in a material as the %RH increases and decreases are shown for a substance that undergoes deliquescence. There may be other interpretations, but my view is that between 70-80 %RH an inflection in the curve is caused by the substance starting to deliquesce as it adsorbs moisture. In the drying cycle of reducing %RH the substance returns to a solid state at 70-80 %RH. Note that the substance having been exposed to moisture prevents its released at lower %RH and the same starting %RH value is not achieved. One reason could be that a new crystalline state trapping in water molecules has been formed and this substance is displaying polymorphism.

Moisture Profiling

Relequa’s MP-1000 Moisture Profiling™ System can performed the task of identifying the deliquescence relative humidity at ambient temperature. The API in the lead photo was found upon testing by Moisture Profiling™ to have a Water Vapour Equilibrium Point (WVEP) of 29%. To avoid moisture uptake and prevent deliquescence in this case, the API should be handled in an atmosphere below 29 %RH. If we had tested the rock salt of the candle holder, we would find that the WVEP would be around 75%.

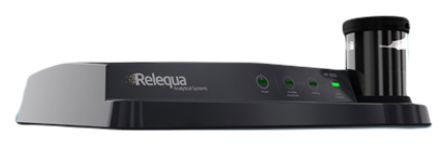
In less than an hour, the WVEP of an API can be determined using the MP-1000 Moisture Profiling™ System.

A Perception of Local Climate Change

My local climate has definitely changed. Not only does it seem that it has, which is just a feeling, but also supported by other people saying the same thing. There is in addition to this, evidence in the way plants are starting their growing season much earlier. Our rhubarb is already big enough to pick and we still have plenty in the freezer from last year because it grew so well. I thought maybe it was a good time to pull together the rainfall data I’ve collected over the years and have a look to see if the weather is truly wetter.

In February 2016 I wrote an article “Weather – Is it getting wetter?” and that followed on from an article I wrote on the extreme weather in the UK causing the worst floods “in living memory” in 2015. My rainfall data at that point did show an upward trend over 2010 to 2015 indicating that the weather could be getting wetter. A caveat I included in the article was that the timescale was very limited for monitoring climate change. Would my rainfall data now spanning 12 years tell the same story? Well, let’s find out.

I’ll start with a graph because people like graphs.

This graph shows the total from each year by adding up all the rain from individual days. When I wrote my article on rainfall at the beginning of 2016, you can see from the trend going from 2010 to 2015 why I thought we were getting more rain than usual. But then look what happens. Over the next three years, 2016 to 2018, we had lower rainfall and all about the same amount. In the past three years we see a wetter one in 2019, followed by decreasing amounts with 2021 coming down to 2016 to 2018 levels.

So now we have a bit of dilemma in that the data do not match our recent perception of the climate as getting wetter. Perhaps looking at the monthly rainfall might reveal something.

In each year the graph shows rainfall per month going from January to December. The pattern of rainfall just looks like “noise” with no obvious trend. One outstanding month is December 2015 when we had an awful lot of rain. This is probably what led me to writing my first post on rainfall in January 2016.

Still on the hunt for an explanation to our perception of a wetter climate, the next step to take is to drill down in the data to daily rainfall. Playing around with plotting in Excel I came up with the next graph.

The right hand column of coloured dots for each year is the day of the month, 1 to 30 for November. Each of these dots is linked by a line to the amount of rainfall on that day. By showing the data in this way it is easy to see on which days the rain was heaviest. Again, as we saw above for the yearly and monthly rainfall, there is nothing that jumps out at you as a pattern for change to a wetter climate.

Comparing the normally wetter winter months, November to February, a sequence of weather seems to be generally consistent. November and February are similar in having some dryish years and some very wet years. January is the driest of the winter months and clearly December is the month to expect days with really heavy rainfall. The very large amount of rain on one day in December 2018 was due to Storm Deidre and reported as follows on the Met Eireann website:

High pressure established itself over Scandinavia on the 12th and the airflow over Ireland backed to south or southeast up to the 15th. The bulk of the rain during this period fell in the South. On the 15th, Storm Deirdre deepened rapidly as it moved across the country giving widespread heavy rain and very strong winds

A similarly heavy day’s rain you can see in December 2013 was another winter storm, but in this case, unnamed as this was before the practice of naming storms.

Having gone through this analysis of my local rainfall data I have eliminated an increase in rainfall as a reason for our perception of a wetter climate. I want to emphasise here the word “local” because clearly other parts of Ireland and the British Isles generally have seen record amounts of rainfall leading to flooding in places where people cannot remember doing so in “living memory”.

Two observations from recent years, particularly 2021, have directed my thinking about this perception of a wetter climate. From August to the end of that year any heavy and persistent rain caused our lawn to partially flood.  Despite us taking measures to reduce the amount of run-off rain onto the lawn, parts were still flooding. Speaking with somebody who had spent Christmas 2021 with his mother in England, said he had also seen flooding on his mother’s lawn that he could not remember happing before.

The second observation is that the relative humidity readings (%RH) from our weather station seemed to remain high all year, including over the summer. These readings are not recorded for reasons I’ll not go into here, but it is to do with a technical matter around Davis weather stations and the difficulty of interpreting historical humidity data..

My hypothesis based on these observations is that persistent high humidity has reduced evaporation of water from the soil. To understand the link between %RH and evaporation, have a read of the technical section of my eBook “A Wetter Look At Climate Change” and particularly the chapter in which I talk about not being able to dry your clothes on a damp day.

If the amount of water evaporating from the soil is reduced, then the water table remains higher than normal. So, after some very heavy showers or persistent heavy rain over a couple of hours, the water table is quickly topped up to the level of the soil surface. Today, the 9th March, is one of those days. Met Eireann has issued a yellow status wind and rain warning from earlier this morning and our lawn is flooding. As are parts of a gravel path and I cannot get to my car without paddling through a large puddle!

The overall impact of having continuous high humidity, seeing parts of the ground flooding and slow to dry, has, I think, led to our perception of a wetter local climate. No doubt, and Nature is showing us, the Earth’s climate is warmer and that will in itself lead to more moisture in the air. Consequences of this will manifest themselves in many different ways.

I write about how humidity and moisture effects everything around us. If you would like to hear more on the impact of moisture, various topics on moisture and humidity are discussed in my eBook “A Wetter Look At Climate Change”.

The story of the three little tablets

We all like a story with a feel good ending.

Here is the story of the three little tablets and the Big Bad Humidity.

There once were three little tablets that had just graduated from R&D with their DSC, TGA and DVS, ready to start their journey out into the big wide world. One of the little tablets even graduated from R&D with honours in high amorphous content. In the beginning they were well made up, and in their API hearts, very happy with their polymorphic state.

The first little tablet built its home in the wrong season of the year. To make matters worse, climate change made it almost impossible to find any part of the year to be safe. Along came Big Bad Humidity and said “I will adsorb, and adsorb, and adsorb moisture on to you little tablet”. Before long, the first little tablet’s API heart was broken into pieces and the R&D doctor diagnosed chronic hydrolysis. That was the end of life on the shelf for the first little tablet.

The second little tablet built its home more soundly and had the wisdom to wear a moisture barrier film coat. But things change, as they often do, and the second little table changed its coat for a new TiO2-free coat. Along came Big Bad Humidity and said “I will adsorb, and adsorb, and adsorb moisture on to you little tablet”. Poor second little tablet was soon very alone because nobody wanted a tablet that had become all squidgy inside. Second little tablet had to be recalled back to where it was born, and the R&D doctor was sacked.

The third little tablet built its home in a different way. Clever third little tablet monitored what was happening with Big Bad Humidity. Third little tablet went to a Relequa® Moisture Profiling™ clinic and learned where Big Bad Humidity was weak. Along came Big Bad Humidity and said “I will adsorb, and adsorb, and adsorb moisture on to you little tablet”. But third little tablet simply ignored Big Bad Humidity and lived happily ever after in humidity equilibrium to the end of its good shelf life.

And the moral of the story is?

Be in control of moisture at all times.

Relequa® Moisture Profiling™.

I write about how humidity and moisture effects everything around us. If you would like to hear more on the impact of moisture, various topics on moisture and humidity are discussed in my eBook “A Wetter Look At Climate Change”.

The Humidistat

I ended 2021 by sharing a climate change article on LinkedIn. This article concluded with a call to action to become part of the global warming solution and not just whinge about the problem. Now I’m starting 2022 with my own article concerning climate change and what we are doing at home to be part of the solution in our own little way. As events unfolded, and during a discussion with a salesperson, the title for this article “The Humidistat” occurred to me.

Solar panels for us?

Our story begins with one of those emails that are usually ignored. It said that the Irish Government grants for installing solar panels were coming to an end soon. Maybe a good marketing ploy by Active8 Solar Energies, but it was something that had crossed the mind several times over the past few years. After checking Active8 out we booked a home visit to see if our old bungalow was even suitable for solar panels. Fair play to the person taking the call at Active8 as they said the SEAI grant was due to end but had been extended. So, that meant the time pressure was off and we need not rush into something without due consideration.

A good thing about dealing with electricity suppliers online these days is that you can get summaries of your usage. By the time Jerry Cropley the Active8 salesperson turned up at the front door with mask on, I was armed with my annual kWp, the number of panels needed and the cost per panel. Jerry, who was very knowledgeable and helpful answering our solar energy questions, assessed our bungalow to be suitably located (not overshadowed), very good with its south facing, low (30%) pitched roof and type of tiles. The cost was calculated and came in much lower than I’d thought. I was starting to feel good about our potential part in a climate change solution. Signatures added on an electronic notebook and all that was then required was a BER (Building Energy Rating) certification that was inclusive in the cost.

Cavity wall insulation

From many years of involvement in projects, one of the cost-saving measures we watch out for are things that have a tendency to grow ‘arms and legs’ – ramping up the cost. Well, we failed the BER! Of the options presented to us for upping our rating, cavity wall insulation seemed the best. Again, something that we had considered in the past to save energy. At what cost though?

Luckily, we have a local company, Dungarvan Insulation, that does a range of options for insulation. A quick call led to Dave O’Connor coming round in a couple of days, who measured the walls, asked a few questions about the inside of the walls, dry lining was one. Dungarvan Insulation make their own thermobeads for filling the wall cavity, something that appealed to me in a company having that expert knowledge. Raw material for the thermobeads arrives in Dungarvan as a dense powder then steam is used to swell the material to form expanded beads.

Humidity and extractor fans

Dave and I had a great wee chat about humidity. We talked about movement of air in rooms and through buildings. Also, the various options that are offered as solutions to where moisture builds up. Care has to taken that when thinking about insulation options you don’t seal off ventilation causing humidity to build up. Our conversation led into removing high humidity using through-the-wall extractor fans. Moving our chat onto “smart” options, home extractor fans can have humidity control built-in. When the %RH reaches a specified humidity, the fan automatically switches on or off, saving energy from running when not needed. To control this electronically the extractor fan must have a microchip called “The Humidistat”.

After pivoting into My World of Moisture with Dave, back to the all important question: what is the cost?  The answer is surprisingly reasonable. About the cost of an international holiday with a long haul flight. In the current circumstances particularly, we are going nowhere and happy to forego a holiday abroad and save contributing to burning aviation fuel. This was on 20th Dec and now it’s the 10th of January and Mark arrived in a large lorry filled with 80-100 m3 of thermobeads at 8am and finished at noon. Pretty good service I’d say.

Humidistats

Now we’ve reached a good point to suspend my solar panel story until they are installed. Let’s explore The Humidistat. First what does it look like? In the picture I’ve labelled the key parts of a humidistat microchip. This one is made by Honeywell, one of many suppliers of humidistats and they come in various shapes and sizes. To give you some perspective, the one in the picture is about 5mm x 4mm x 2mm. They can be bought up to 1000 chips on a tape. A machine for pick-and place can lift the humidistats from a tape and place them on printed circuits in large numbers, or you can pick off the humidistats yourself and solder the chip by its pins to the copper lines on a printed circuit.

The pins which are numbered 1-8, each can have a function or just used for supporting the mounting. For instance, the one in the picture has Pin 7 designated as “NC” (not for external connection). Voltage in and out is “Pinouts” 1 and 2 in the picture, whereas 5 and 6 are the high and low humidity outputs. Adjustors on an extractor fan fitted with a humidistat allow you to set the humidity range, for example, 60 %RH to 80 %RH. The electronics controlling the switch for the fan reads the output from the humidistat and turns it on at 80 %RH and then off at 60 %RH.

Concerning condensation

The type of humidistat shown in the picture has a hydrophobic (water hating) filter, that you can see in the top of the chip and makes it condensation-resistant. Underneath the filter is a humidity sensor that responds according to the amount of moisture in the air. Water condensing on the sensor will interfere with its moisture measurement and the filter stops this happening in areas of very high humidity, as in a bathroom or shower room.

Earth, a gigantic humidistat

Our planet could be thought of as a gigantic humidistat with a whole load of complex inputs and outputs that has kept the climate fairly steady over thousands of years since the last ice age. We are now seeing a change in that balance of the climate through what we think is a result of hundreds of years of human activity and in particular the industrial revolution. Global warming is heating up the atmosphere and driving more moisture into the air causing a change in our climate, that’s a fact.

I explain the relationship between temperature and humidity in my eBook “A Wetter Look At Climate Change” and talk about the source of extreme weather. Unfortunately for us when it comes to our global humidistat, unlike the microchip, there is no adjuster control for us to set the humidity!

Simply bananas

To finish on a lighter and more positive note. One of our local supermarkets has made a commitment to sustainability and reducing plastic packing. Bananas packed in plastic bags are no longer being put on the shelves. Instead, here’s a picture of the new presentation of their bananas. This appeals to my quirky sense of humour, I’m not going to explain why, just leave it for you to enjoy.

I write about how humidity and moisture effects everything around us. If you would like to hear more on the impact of moisture, various topics on moisture and humidity are discussed in my eBook “A Wetter Look At Climate Change”.

A Question of Moisture and Space

On October 4th somebody from my past got in touch through LinkedIn. We used to work at Delta Biotechnology in Nottingham, didn’t really know each other that well and not had any contact since about 1990. After exchanging messages, a few weeks later I asked my newly reintroduced contact if there was any topic on moisture he would like to see written as an article. That has led me to write this today because something that is interesting for one person is probably relevant and worth writing about for other people.

Before I get started on the topic, let me introduce Michael Geisow, a protein chemist who has reinvented himself as an author. Michael’s first novel is a modern psychological drama around social networking and artificial intelligence: a data expert, a healthcare evangelist, a dodgy psychologist and others including the devious Tuula Pippi. Available on Amazon.

The first thing Michael asked about was condensation on the outside of double glazed windows but dry inside. An easy one really and it’s all about temperature. Condensation like this occurs when high humidity air immediately above the glass surface is cooled taking the relative humidity to 100%. At this point water vapour in the air turns to liquid and forms droplets on the glass. Warmer air around the inner glass pane of the double glazing keeps the moisture in the air as a gas.

Michael’s second question on condensation is trickier. He described outside balustrade panels only having condensation on one side even though both sides are exposed to the same air conditions. I can see his scientific brain at work on this question. Something does not add up! No easy answer this time without further investigation. One unlikely possibility is that one side of the panels is warmer for some reason, but in the open air, natural circulation should be redistributing the temperature. Balustrade panels are made with reinforced glass for safety reasons. Perhaps one side of the glass is coated preventing water droplets forming. Even though a very thin layer of moisture will be present on the coated side, from casual observation, condensation on the other side will be all that is seen. A case where more information is needed to solve this one.

A day later after the condensation questions arrived, a question from Michael about looking for moisture on other planets. I’m not quite sure what Michael had in mind, but this gives me an opportunity to talk about life on other planets and their moons.

Starting in Autumn 2020 I signed up for the Open University course S283 Planetary science and the search for life. The course was split into two parts, one on our Solar System and the other on Astrobiology. I thoroughly enjoyed the whole experience even when having to attend online tutorials and complete assignments that were continuously assessed.

Moisture is present in vast quantities throughout our Solar System. Space scientists and astrobiologists generally work from what we understand about our Earth. Life in the form of microorganisms is found in the most extreme conditions on Earth. Logically we use our planet as a model system to look for life on other planets and moons in our Solar System. One of the driest places on Earth is the Atacama Desert in Chile.

Microbiologists have studied the bacteria and fungi from this region since the 1960’s. But in 2003, NASA published a paper describing Atacama as a model for Mars. That kicked off intense interest in engineering and scientific activity to mimic how to perform tests on the Martian terrain. Let’s start with “Is there water on Mars?” Pictures from the Mars missions compared to geographical features on Earth, indicate strongly that liquid water once flowed on the surface of Mars. Features that look just like riverbeds and erosion by water. We know for sure that water in the form of ice sits at the North and South poles of Mars. Also, there may be water deep underground. Future missions are planned to provide some answers.

As far As far as we know, water is a prerequisite for life. On Earth no life exists that does not rely on water. Back to the arid Atacama Desert. Engineers and scientists have designed machines and testing techniques to detect the presence of microbes in this desolate part of our world. The technology will be placed on board Mars missions and the data from the tests will be beamed back to Earth.

Related to this is a fact that has been known for many years. Microbes do not grow when the relative humidity of the air gets below 60%. In my eBook A Wetter Look At Climate Change and the section related to food, there is a table that shows the lowest %RH for the organisms is 61%. Recent studies on the microbes from Atacama and other arid parts of our planet have shown that there appears to be an absolute limit of 60.5 %RH for growth. For example, a paper published in 2014 with the title: Multiplication of microbes below 0.690 water activity: implications for terrestrial and extraterrestrial life and written as an international collaboration. One of the groups is the Institute for Global Food Security, School of Biological Sciences, Queen’s University Belfast and another is the UK Centre for Astrobiology, School of Physics and Astronomy, University of Edinburgh. So, you can see how things are interrelated. The other co-authors come from NASA, Germany, The Netherlands Italy and France. By the way, you have to multiply the “water activity” in the title of the paper by 100 to get the %RH for growth.

Atacama gets less than 2mm annual rain and has an average %RH of 10, classifying this desert as the driest place on Earth. Fog drifting in from the coast and around the coastal range of mountains into the desert provides microbes with the necessary moisture to keep them alive. These highly specialised organisms live in rocks containing salt. The salt in the rocks attracts moisture that is scavenged by the microbes. The interaction between salt and moisture is also a section in my eBook.

I’ll finish this article with one of my ‘mad’ ideas! On board a future exploratory mission to Mars a humidifier-dehumidifier should be set up to adjust the %RH around soil samples. Based on what we know from Earth, exposing soil to above 60%RH should encourage any viable microbes to grow. A range of temperatures and relative humidity would be needed to discover the growth requirements of these organisms. Soil samples will need to be taken from depths below the Martian surface as Solar radiation has most likely destroyed any past living entity on the surface.  Rock is a good shield against penetrating radiation.

Why is this simple idea ‘mad’? There are protocols in place for limiting risk of Why is this simple idea ‘mad’? There are protocols in place for limiting risk of contamination of extra-terrestrial bodies from space missions known as COSPAR which is a committee of scientists (Committee on Space Research). In Category IV, the second most stringent, covers a mission for “studying chemical evolution and/or origin of life, or for which scientific opinion provides a significant chance of contamination that could jeopardize a future biological experiment”. Perhaps transporting water, even though sterile, and encouraging growth of microbes is against the protocol.

The idea is so simple that it must have been thought about, yes?

I write about how humidity and moisture effects everything around us. If you would like to hear more on the impact of moisture, various topics on moisture and humidity are discussed in my eBook “A Wetter Look At Climate Change”.

Covid viral droplet

Covid Droplets in the Air

Little did I know that my Coughs and Sneezes Spreads Moisture article, written pre-pandemic, would become so relevant for so many people. Out of sheer annoyance I wrote the article because somebody sneezing on a bus in Edinburgh caused me to bring a cold virus back to Ireland giving me several days of suffering.

This post is about the droplets we exhale, by sneezing, coughing, talking and even simply breathing, that can transmit Covid through the air to infect another person. If you’d like evidence of creating airborne droplets by just simply breathing, walk outside on a really cold morning and see your breath materialise into a cloud of droplets. Watch how they disperse and disappear. So, what has happened and why is this important in spreading Covid?

The mist you see appearing from your breath is made up of millions of water droplets. These quickly spread out and evaporate in the air causing them to get smaller and smaller until they are no longer visible. When we sneeze and cough a lot more fluid is expelled as heavier droplets which are acted upon by gravity and fall to the ground, or onto any nearby surface.

Now let’s think about what these droplets contain. If what we breathe out was pure water, the droplets would evaporate to water vapour becoming part of the moisture in the air. Expelled larger droplets from a cough or sneeze contain bodily fluids and tissue (cells) and this changes what can happen to them. Instead of evaporating away, the water in the droplets, when at higher relative humidity (%RH), is not lost as quickly or even at all. This last fact is key to understanding Covid indoor transmission.

Keeping in mind droplet size and %RH being linked with the spread of Covid, let’s look at winter. A physical property of water is that the maximum amount of water the air can hold depends on temperature. When the temperature is high, as in summer, the air can carry a lot more moisture. But in cold winter conditions the air quickly becomes saturated with moisture. We breathe out on a cold morning and our warm moist breath hits a sudden temperature drop and, like dew on grass, the moisture condenses to water droplets.

We are advised to open a window to let out Covid. This makes sense as Covid virus particles (‘viral droplets’) breathed out when indoors can continually build up in the enclosed space. Potentially the situation gets worse in winter. Cold outside air comes into a heated building and is warmed. This reduces the %RH of the air making it drier. Low %RH air causes our expelled larger droplets to evaporate faster reducing their size. As the larger droplets turn into very small ones they can float around in the air for several hours. In the light of this, opening windows for fresh air circulation becomes a good idea for evacuating these small viral droplets out of the house.

Research on Covid is showing that indoor infection rates drop off quickly at 75 %RH and above. At this humidity, viral droplets can increase in volume by water absorption from the air (the opposite of drying) and makes the droplets heavier. Their movement then throughout the air is restricted by the pull of gravity shortening the time they are available to be breathed in. The drop off at 75 %RH is not a lower limit as there is a trend of decreasing infection rate from about 40 %RH upwards. It is being suggested that offices and public places should be controlled by humidification/dehumidification in the zone of 40 to 60 %RH, not just for comfort, but now also for safety. However, at higher humidity the droplets will remain droplets for longer as they resist drying out. Contact by touching a surface with viral droplets is another route for infection so hand sanitation is critical also.

Martin Byrne is somebody I’ve known for many years. His company, Envirosafe Ireland, sells containment technology. Last week, Martin shared a post on LinkedIn which was quite timely with me starting to think about writing this article. Martin’s post was a link to an article on removing airborne virus using filters in wards at Addenbrooke’s Hospital, Cambridge, UK. In this article it says “..during the first week prior to the air filter being activated, the researchers were able to detect SARS-CoV-2 on all sampling days. Once the air filter was switched on and run continuously, the team were unable to detect SARS-CoV-2 on any of the five testing days. They then switched off the machine and repeated the sampling – once again, they were able to detect SARS-CoV-2 on three of the five sampling days.” My impression of hospitals is that they are always too hot and dry, so it seems like one effective way of controlling Covid is to have airborne viral droplets filtered out of the air.

Science and technology give us hope as we gain both greater understanding of Covid infection and new tools in the fight against this highly infections and dangerous virus. But a big part of the battle is for us to take personal responsibly to protect ourselves and our fellow humans. Common sense, that rare commodity these days, would go a long way to help.

I write about how humidity and moisture effects everything around us. If you would like to hear more on the impact of moisture, various topics on moisture and humidity are discussed in my eBook “A Wetter Look At Climate Change”.

Natural Fibre Composites

After a long gap I am returning to my blog. During last lockdown I decided to learn a new skill and gave myself a 30 day challenge to touch type. My blog is a great opportunity to practice my typing without looking at the keyboard. The topic I have chosen is another thing stumbled upon when researching moisture that popped up when searching by Google on a completely different subject.  This was a completely new topic for me and something I’d not come across before. As with some other topics I have written about, some new terminology cropped up. So, let’s have brief venture into Natural Fibre Composites (NFCs) and of course my take on these materials and their relationship with moisture.

NFCs

NFCs, what are they? Apart from the moisture aspect, what caught my attention in NFCs was using naturally sourced fibre materials to replace plastics such a nylon, and polyester. Some of the natural source I’d heard of; flax (cotton of course), jute and hemp, others new to me, kenaf and ramie and some more exotic tropical plants, acrea palm and rux. Materials that are natural with a potential for reducing the amount plastic waste in the environment has to be investigated. From the amount research literature on NFCs I’ve come across since these materials are being taken very seriously. As vegetable matter that is already grown in vast quantities, converting this to NFCs as substitutes for plastics has to be attractive. But it’s never that simple is it?

Biodegradable

A tantalizing prospect is that as vegetable derived material it is completely biodegradable and as waste much better for environment helping to reduce disposal of plastics and the consequential  microplastics.

Here’s the rub, vegetable material naturally interacts with moisture as part of Nature’s recycling processes. Moisture weakens the strength of the fibres so to counteract this the fibres have to be further processed to prevent moisture uptake. Various approaches for doing this are being researched on different types of vegetable fibre resulting in ‘composites’, hence the name NFCs.

“Retting”, and the difference between green and mechanical retting.

Green retting is the traditional way of preparing flax and other plant fibres.

The plants are laid out after cropping directly in the field. Natural processes that require moisture, break down the soft plant tissue and the fibrous stem material is harvested. A skilled farmer would harvest just at the right time where the soft tissue is broken down just enough to allow its separation from plant fibre and before the fibre itself degrades. Plant fibre prepared in this way is called “bast” and different plants produce bast with varying properties. Some more suited to weaving into everyday clothes others for making heavy duty materials. Mechanical retting separates bark, soft tissue, fibres and woody core that have a range of uses. However, lacking the natural microbial breakdown activity the bast fibre obtained in mechanical retting is a crude product and needs further treatment such as water retting to obtain a higher grade plant fibre.

Combined green and mechanical retting

In a recently published paper the authors describe a combined green and mechanical retting process. Hemp plants are left standing in the field, “stand-retting”, and natural microbial breakdown is allow continue for a period.

Microorganisms need moisture and, although the hemp is starting to dry at this stage, the plant material picks up moisture from the atmosphere. The authors describe moisture uptake occurring by the “need” to reach an “equilibrium moisture content between the plants and the atmosphere”. This type of moisture interaction is humidity driven and explained in the Technical section of my eBook. After 4 months “stand-retting”, the crop was harvested using a mechanical retting machine. “Stand-retting” had made the separation of the plant fibres more efficient for mechanical retting.

Researchers are looking at how to expand the uses for the vast amount of bast fibre currently produced worldwide. Some of the focus is on how to treat the fibres to prevent of lessen the fibres ability for moisture uptake. A complete substitution for plastic would be ideal. Of course, there is always a price to pay and the treatments, particularly the chemical ones, will have to be balanced against the potential waste generated at industrial scale. In the immediate future most likely the NFCs will be a combination of plant fibre and plastic, at least, this reduces plastic use.

Moisture and Water

Time to get on my Irish Hobby horse (possibly the source of the “to get on your hobby horse” expression for incessantly talking or complaining about something).  Published scientific papers on NFCs that include studies on the impact of water on the properties of the fibres use the term moisture. The actual standard test, named ASTM D570, describes immersion of a material in liquid water and the test results in a water-absorption value. In my understanding, “moisture” is defined as water vapour in the air. Authors of some of the published papers refer in their text to moisture absorption or moisture uptake. Some even use the terms “water” and “moisture” interchangeably as though there was no difference. A trivial point you may think, but not to me…..I find it just as annoying when people who should know better use the words bacteria and virus as if there is no difference, but that’s another story.

The subtle bit here is once the NFCs have absorbed water, the test to give the water-absorption value is a test for moisture. By heating a sample of the material, water is driven from the surface as moisture when it enters the air around the sample. The assumption is that all of the water absorbed from the liquid state is released as moisture. No water should remain the sample therefore all the moisture released equals the amount water that was in the sample. There you go, easy!

I write about how humidity and moisture effects everything around us. If you would like to hear more on the impact of moisture, various topics on moisture and humidity are discussed in my eBook “A Wetter Look At Climate Change”.

Deliquescence of a powder in pictures

If you would like to find the explanation to the pictures, read my eBook, A Wetter Look At Climate Change.

Life on Mars

Being old enough to remember when David Bowie brought out “Life on Mars” and watching him on Top Of The Pops, it’s great to see the renewed fascination with this planet. We get headlines about the findings from the various missions circling around and landing on the Mars surface. Behind those headlines there’s a fantastic amount of science going on that we don’t hear about unless you’re really into space exploration. Astrobiology is the area of science I’m drawing from to write this blog post. Especially about the limits for microbes to grow and how they get their water…….

A fact that has been known for many years is that microbes do not grow when the relative humidity of the air gets below 60%. In the FOOD section of my eBook A Wetter Look At Climate Change there is a table that shows the lowest %RH for one of the organisms is 61%. The two organisms at the bottom of the table are Xerophilic, which means, high tolerance and able to survive in dry conditions. This is where “Life on Mars” is relevant.

Atacama Desert https://en.wikipedia.org/wiki/File:Atacama.png

In South America there is an area that is the most “arid” place on Earth. An area defined as arid has little or no rain and is too dry or barren to support vegetation. The Atacama Desert, located in northern Chile, is accepted as being the driest and oldest part of our planet. Microbiologists have studied the bacteria and fungi from this region since the 1960’s. But in 2003, NASA published a paper describing Atacama as a model for Mars. That kicked off intense interest in engineering and scientific activity to mimic how to perform tests on the Martian terrain.

The big question “Is there life on Mars?”

Let’s start with “Is there water on Mars?” Pictures from the Mars missions compared to geographical features on Earth, indicate strongly that liquid water once flowed on the surface of Mars. Features that look just like riverbeds and erosion by water. We know for sure that water in the form of ice sits at the North and South poles of Mars. Also, there may be water deep underground. Future missions are planned to provide some answers.

Mars showing the ice capped poles https://en.wikipedia.org/wiki/Mars

Does water always mean life?

As far as we know, water is a prerequisite for life. On Earth no life exists that does not rely on water. Back to the arid Atacama Desert. Engineers and scientist have designed machines and testing techniques to detect the presence of microbes in this desolate part of our world. The technology will be placed on board Mars missions and the data from the tests will be beamed back to Earth.

All very exciting and high tech this stuff. In my reading of the published papers on the microbiology and molecular biology of the Atacama organisms, I went looking for evidence of microbial growth in an environment that is predominantly below 60%RH. I thought, if anybody can find such Xerophiles, these guys might.

I was encouraged when I found this statement in a review paper: “This work definitively validated the Atacama Desert as a Mars analogue and also as an unparalleled place to pursue studies on the dry limit for life.” In my mind, coloured by my quest for an explanation for the 60%RH microbial growth limit, I read this as a search for organisms that can scavenge in low moisture conditions. By low moisture conditions, I mean at a humidity below 60 %RH.

A problem with doing science outside of the laboratory is the things going on that are not under your control. Looking at the weather conditions for Atacama with less than 2mm annual rain and average %RH of 10, it is easy to classify this desert as the driest place on Earth. So, what can get in the way of looking for life in such a low moisture environment? Fog for one. Drifting in from the coast and around the coastal range of mountains into the desert this moisture can provide organisms with the necessary moisture to keep them alive. What the scientists observed is a fall off in the total number and different types of organisms as they went from the edges of the desert towards its middle.

Fog advancing over the coastal range on the Pacific Ocean side of the Atacama Desert
From: Life at the dry edge: Microorganisms of the Atacama Desert Armando Azua-Bustos, Catalina Urrejola, Rafael Vicuña

After my initial excitement of maybe getting an answer to the 60 %RH growth limit for microbes, I was becoming disillusioned. Seemed like the microbes were simply scavenging moisture when it was carried across parts of the desert by fog. Frustrated by not making progress on the 60 %RH growth limit question I contacted one of the authors of a review paper “Life at the dry edge: Microorganisms of the Atacama Desert”. His name is Armando Azua-Bustos, an Astrobiologist working in Spain. We had a Skype call in which, at last, I saw hope on the horizon.

Armando told me about controlled laboratory experiments where he studied the Xerophiles from the Atacama Desert. Under low %RH conditions mimicking the Atacama Desert he detected one of the key signs of a living organism. All living creatures must have an active metabolism to live and certain molecules are produced and used within living cells. Using sensitive probes for the molecules of life, activity was seen in the Xerophiles at 10% and 30% humidity. Well below the 60% limit.

My chat with Armando got even better. He told me about how cells can protect themselves against dehydration. Certain types of sugar molecules and proteins are produced by the Xerophiles. One of the key sugars is called Trehalose that can substitute for water molecules within the cell by interacting with other key molecules. I knew about Trehalose from my past where I used it to protect yeast from freezing when storing at -20°C. Another type of molecule mentioned by Armando is Dehydrins. These are small proteins that can also substitute for water molecules within the cell. Both Trehalose and Dehydrins are produced in cells that are under stress from dehydration. Armando described the inside of the cell becoming more like a gel rather than a watery soup.

Trehalose

The picture we now have of Xerophiles is that, when the environment gets drier, the protective molecules, Trehalose and Dehydrins, allow the cell to continue to metabolise with less water. However, further dehydration would stop metabolism completely, which means cell death. Armando suggested that Xerophiles have evolved biochemical pathways to counteract dehydration by producing within the cell a small amount of water for metabolism. This is what Armando and his colleagues are detecting using their probe for metabolic activity. In other words, the Xerophiles respond to drought by protecting themselves and then turn on a water production mechanism.

So, with my question answered about the 60% growth limit, what about the Big question, Life on Mars? Science is telling us that a key sign of life, metabolism, is looking feasible under the dry conditions present on Mars. Does that mean there could be the possibility of organisms growing in that environment? We don’t know yet.

Earth and Mars were created around the same time, about 4.6 billion years ago. Mars started to lose its atmosphere and ability to support liquid water about 4 billion years ago. But it took a further 0.5 billion years (3.5 billion years ago) for life to evolve on Earth. This raises the question of would there have been a sufficient time for life to have evolved on Mars before it became too dry? If life had evolved, is it possible that Martian Xerophiles would be able to sustain low level metabolic activity over the billions of years since it became dry? Armando and his fellow Astrobiologists will one day let us know.

NASA have discovered large underground lakes of water on Mars. One of these is frozen and is the size of Lake Superior, another is liquid. Also, it is possible that underground water could be warmed by the sun and trapped in caves where it could support life. This all adds to the thrill of there being Martians out there, albeit most likely micro-ones!

Welcome to my world of moisture

If you would like to hear more about moisture and humidity in everyday life, please sign up for email alerts of my blogs.

Episode 4: Got there in the end!

A double meaning in the title. One, eventually after being very busy with Relequa I’ve found a little bit of time to publish the last episode. Two, we have completed the home for Relequa.

Back to the story. After we had thawed out after the Beast from the East the lads were back on site. Michael the Carpenter finishing off the roof, Eugene the Strong finishing off walls. In this blog, the fourth and last episode of finding Relequa a new home, I’ll take you to completion of the build to our fitted out “Alternative Alpine Lodge”.

The lads had recommended Munster Joinery, an Irish windows and doors company, that has built itself from a start-up in Munster to a large international company, supplying and fitting their products across Ireland and the UK. We were soon ready to act upon the quote from Munster Joinery. The Beast from the East did set a lot of people back and we had to wait longer than we expected for the windows and doors to arrive. But, arrive they did, and no problems with fitting. Surprisingly quick actually, with the fitters going off to another job on the same day.

Windows and doors in place we were on another cycle of Michael the Carpenter, Kieran the Plasterer and Mícheál the Electrician. Time now to introduce you to our last character, Gregor the Tiler, a giant of a man from Poland. Gregor the Tiler didn’t talk much. Three areas were planned for tiling; reception, toilet and my office come “sun” room.

The next sequence of events within my “sun” room was more or less the same as the garage refit with timber, plasterboard and plastering stages. While this was going on, I started painting the ceiling of what was to become the meeting room. After three coats of paint I surrendered and we got in painters. Apparently, I was using the wrong paint for the light in the room!

Apart from drying plaster that I talked about in Episode 3, there was nothing inside or outside relating to moisture to explore further in my “world of Moisture Matters”. Not until we were fully fitted out did an interesting moisture issue arise.

As well as making our Relequa Moisture Profiling System, we also get involved in project work. Our first project was for a company called Sepha who make small scale pharmaceutical equipment for R&D laboratories and Clinical Trial manufacture and packing of tablets and capsules.

Sepha had just launched their new invention for testing how good the foil seal is (“integrity”) on blister packs. Up until this invention, pharmaceutical manufacturers had to take a statistical sample of blisters from a batch and test the “integrity” of the seal using a machine that forces dye into the blister pockets. Blister pockets picking up the dye would fail the test. This dye test, used for many, many years, works on the principle of having a significant fraction of the batch of blisters not failing, and so the rest of the batch is passed for use. Sepha’s new machine called VisionScan, uses a technique which allows 100% of the blisters in a batch to be checked for leaks without damaging the tablet or capsule in the pocket, or the blister pack itself.

The project with Relequa was devised to use moisture movement as a way for testing the “integrity”  of blisters after treatment with VisionScan. If treatment affected the “integrity” of the blister seal then moisture would be taken up by a tablet inside the pocket. A gain in moisture of a tablet is easily detected using our Relequa Moisture Profiling System. Moisture Profiling of tablets was done before and after VisionScan treatment and then over a period of several weeks after storing the blisters at high humidity.

We showed that the tablets we chose could easily pick up moisture and this, if occurred, would be detected in tablets from VisionScan treated blisters. No difference in tablet moisture was seen between the tablets from blisters treated by VisionScan compared to untreated blisters. The conclusion was that the VisionScan treatment had no impact on the “integrity” of the seal. This project was written up by an independent author at Ulster University as a whitepaper in the European Journal of Pharmaceutical Science and is free to download.

Earlier I mentioned an interesting issue that came up. Due to technical reasons around making tablets, that I’ll not go into here, we chose to make the tablets for the Sepha project from a sugar called Xylitol. When the Sepha project was completed, I obtained the bulk of the tablets that were not packed into blisters. My intention was to use these for calibrating the MP-1000, our new Relequa Moisture Profiling System.

Customers who have bought an MP-1000 can check if the system is functioning as it should. To do this we supply them with tablets from a batch that we have already tested. These tablets are sealed in a moisture resistant pack. The pack is a bag made with a high moisture-barrier material. We put in a number of tablets and heat seal the bag.

Before releasing the calibration tablets for use, the sealed bags were put into high humidity conditions and at weekly intervals a bag was removed, the tablets taken out and immediately checked on the MP-1000. What happened next was unexpected.

Using my many years of experience working with moisture issues, I knew from i) the starting condition of the tablets, ii) the quality of moisture-barrier material of the bag and iii) the ambient humidity, that no moisture transfer should occur over the time the bags were stored. However, I couldn’t argue with data that clearly showed that the tablets from the sealed bags were picking up moisture. So what on earth was going on?

At times, to solve a problem, it’s only about using “all” the information that’s available to you, even when it’s not directly related to the thing you are investigating. When you hear the answer, you’ll probably think “of course it’s related” but that is the power of hindsight.

Back to the Sepha project for a clue. As part of the testing protocol I built in what is known as a “positive control”. Using a hypodermic needle, a tiny hole was put into some of the blister pockets of the packed Xylitol tablets. These were placed, along with the other blister packs, at high humidity. After a week the tablets from the pockets with a hole had dramatically picked up moisture. Other tablets from intact pockets were unchanged. When attempting to test the tablets from the pockets with a hole that had been at high humidity for two weeks, no testing could be done because the tablets had turned to mush!

That mush was the clue. Our Xylitol tablets were undergoing deliquescence, a property of salts and sugars that I’ve talked about before on my blog posts. These tablets were chosen because of their ability to take up moisture. Where this was an effective property for the Sepha project, it was too effective for using the same tablets as a stable source of moisture calibration material.

The moisture barrier bags, in which the Xylitol tablets were packed as calibration tablets, are only moisture resistant and not an absolute barrier to moisture transfer. With the external humidity fluctuating around 65% RH a small amount of moisture passed through the material of the bag. The driving force for this to happen is that the tablets are continuously absorbing moisture as they move towards deliquescence.

My only option was to have different types of tablets prepared and start again with a moisture testing time course experiment.

Welcome to my world of moisture

Next topic: Life on Mars.

If you would like to hear more about moisture and humidity in everyday life, please sign up for email alerts of my blogs.

Page 1 of 4

Powered by WordPress & Theme by Anders Norén