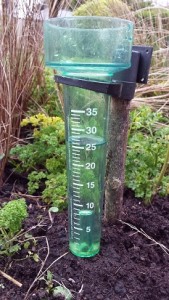
Rain Gauge – 25 mm rain = 1 inch
Two years ago this week (11th Feb 2014) I wrote an article on the extreme weather in the UK causing the worst floods “in living memory”. A commentator in the media made a point about the rain being in the wrong place at the wrong time. What he meant was, if the same amount of rain had steadily fallen in the mountains and filled the reservoirs, that would have helped with the managed water supply. Instead we saw flash flooding affecting built up areas and causing immense, and such painful, grief for lots of people.
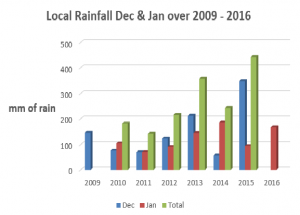
Out of my own interest in rainfall I put my local rainfall data for Nov, Dec and Jan for the years 2009 – 2014 onto a chart. It showed the Total rainfall in each month fluctuated as expected but there was no dramatic increase in the overall volume that fell. I have just done another chart showing the monthly and total rainfall to include the past three months and the story is now different.…
Freaky or is this going to be normal weather?
Here is a link to my “freaky weather” article that I wrote on the 11th Feb 2014 and in one part I say, “…just three days ago we had about 35mm of rain overnight from a storm that went on to hit the UK”.
Again as I write there is storm brewing in the Atlantic, Storm Imogen. So now up to “I” in the Weather Alphabet.

In a change of format, I’ve done my updated rainfall as a bar chart. Showing the data in this way makes it easy to see two things. First is the extraordinary amount of rain we had in December 2015. Not surprising it broke rainfall records for the month. Second, by simply looking at the green bars of the combined rainfall for December and January from 2011 onwards, there does appear to be an upwards trend.
Over the timescales needed to be confident in weather trends I’m showing very limited data but there’s no denying that, over the past three winters, things have been getting wetter.
If you would like to hear more about how weather and moisture affects our everyday life, please sign up for email alerts of my blogs.
Welcome to my world of moisture

Leave a Reply