My World of Moisture

Tag: Weather

A Perception of Local Climate Change

My local climate has definitely changed. Not only does it seem that it has, which is just a feeling, but also supported by other people saying the same thing. There is in addition to this, evidence in the way plants are starting their growing season much earlier. Our rhubarb is already big enough to pick and we still have plenty in the freezer from last year because it grew so well. I thought maybe it was a good time to pull together the rainfall data I’ve collected over the years and have a look to see if the weather is truly wetter.

In February 2016 I wrote an article “Weather – Is it getting wetter?” and that followed on from an article I wrote on the extreme weather in the UK causing the worst floods “in living memory” in 2015. My rainfall data at that point did show an upward trend over 2010 to 2015 indicating that the weather could be getting wetter. A caveat I included in the article was that the timescale was very limited for monitoring climate change. Would my rainfall data now spanning 12 years tell the same story? Well, let’s find out.

I’ll start with a graph because people like graphs.

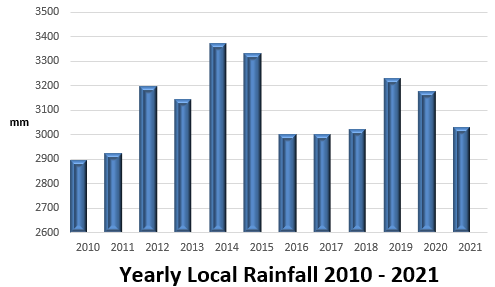
This graph shows the total from each year by adding up all the rain from individual days. When I wrote my article on rainfall at the beginning of 2016, you can see from the trend going from 2010 to 2015 why I thought we were getting more rain than usual. But then look what happens. Over the next three years, 2016 to 2018, we had lower rainfall and all about the same amount. In the past three years we see a wetter one in 2019, followed by decreasing amounts with 2021 coming down to 2016 to 2018 levels.

So now we have a bit of dilemma in that the data do not match our recent perception of the climate as getting wetter. Perhaps looking at the monthly rainfall might reveal something.

In each year the graph shows rainfall per month going from January to December. The pattern of rainfall just looks like “noise” with no obvious trend. One outstanding month is December 2015 when we had an awful lot of rain. This is probably what led me to writing my first post on rainfall in January 2016.

Still on the hunt for an explanation to our perception of a wetter climate, the next step to take is to drill down in the data to daily rainfall. Playing around with plotting in Excel I came up with the next graph.

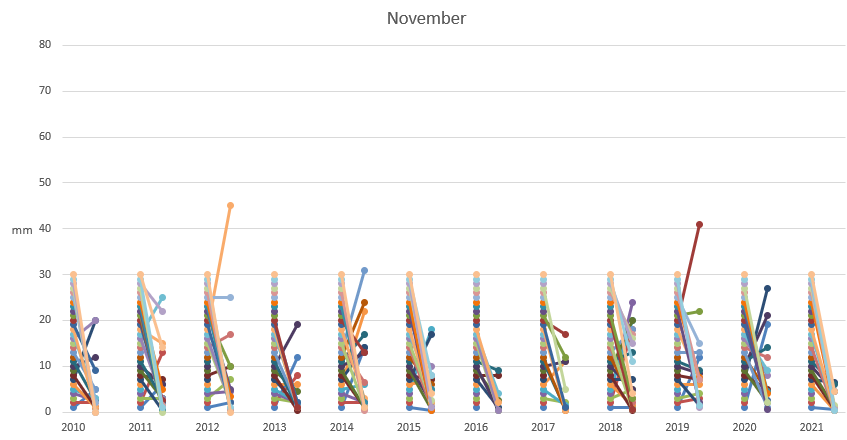
The right hand column of coloured dots for each year is the day of the month, 1 to 30 for November. Each of these dots is linked by a line to the amount of rainfall on that day. By showing the data in this way it is easy to see on which days the rain was heaviest. Again, as we saw above for the yearly and monthly rainfall, there is nothing that jumps out at you as a pattern for change to a wetter climate.

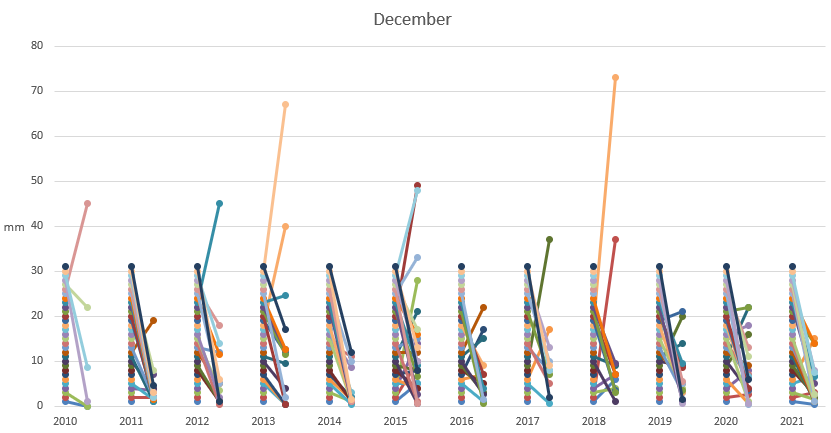
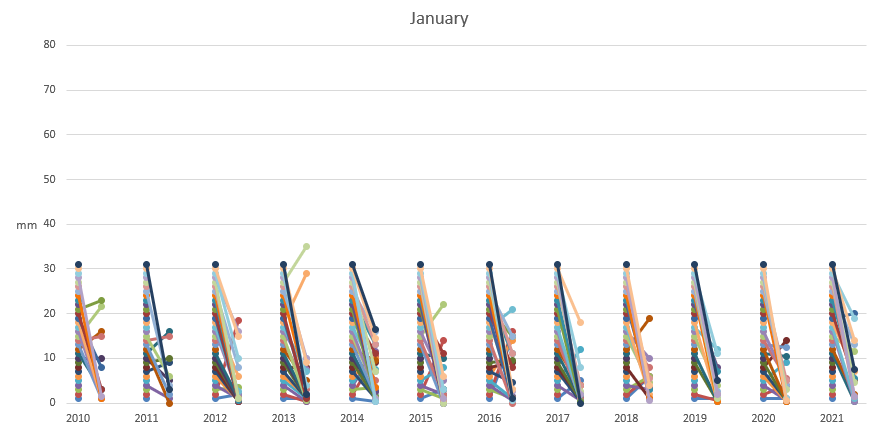
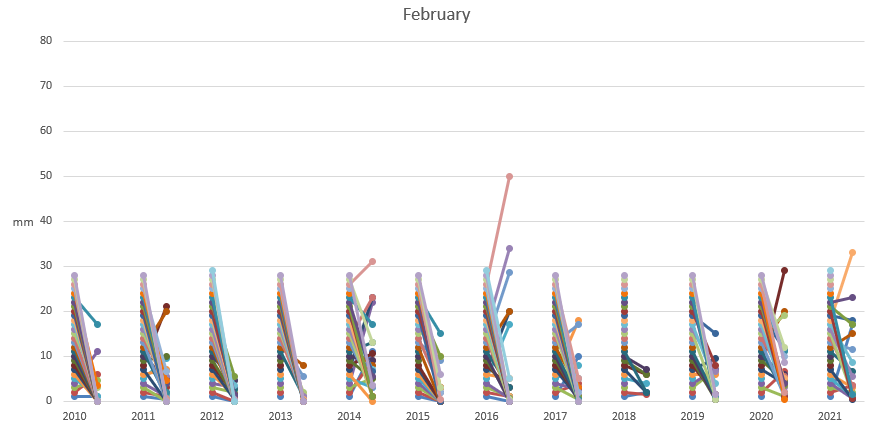
Comparing the normally wetter winter months, November to February, a sequence of weather seems to be generally consistent. November and February are similar in having some dryish years and some very wet years. January is the driest of the winter months and clearly December is the month to expect days with really heavy rainfall. The very large amount of rain on one day in December 2018 was due to Storm Deidre and reported as follows on the Met Eireann website:

High pressure established itself over Scandinavia on the 12th and the airflow over Ireland backed to south or southeast up to the 15th. The bulk of the rain during this period fell in the South. On the 15th, Storm Deirdre deepened rapidly as it moved across the country giving widespread heavy rain and very strong winds

A similarly heavy day’s rain you can see in December 2013 was another winter storm, but in this case, unnamed as this was before the practice of naming storms.

Having gone through this analysis of my local rainfall data I have eliminated an increase in rainfall as a reason for our perception of a wetter climate. I want to emphasise here the word “local” because clearly other parts of Ireland and the British Isles generally have seen record amounts of rainfall leading to flooding in places where people cannot remember doing so in “living memory”.

Two observations from recent years, particularly 2021, have directed my thinking about this perception of a wetter climate. From August to the end of that year any heavy and persistent rain caused our lawn to partially flood.  Despite us taking measures to reduce the amount of run-off rain onto the lawn, parts were still flooding. Speaking with somebody who had spent Christmas 2021 with his mother in England, said he had also seen flooding on his mother’s lawn that he could not remember happing before.

The second observation is that the relative humidity readings (%RH) from our weather station seemed to remain high all year, including over the summer. These readings are not recorded for reasons I’ll not go into here, but it is to do with a technical matter around Davis weather stations and the difficulty of interpreting historical humidity data..

My hypothesis based on these observations is that persistent high humidity has reduced evaporation of water from the soil. To understand the link between %RH and evaporation, have a read of the technical section of my eBook “A Wetter Look At Climate Change” and particularly the chapter in which I talk about not being able to dry your clothes on a damp day.

If the amount of water evaporating from the soil is reduced, then the water table remains higher than normal. So, after some very heavy showers or persistent heavy rain over a couple of hours, the water table is quickly topped up to the level of the soil surface. Today, the 9th March, is one of those days. Met Eireann has issued a yellow status wind and rain warning from earlier this morning and our lawn is flooding. As are parts of a gravel path and I cannot get to my car without paddling through a large puddle!

The overall impact of having continuous high humidity, seeing parts of the ground flooding and slow to dry, has, I think, led to our perception of a wetter local climate. No doubt, and Nature is showing us, the Earth’s climate is warmer and that will in itself lead to more moisture in the air. Consequences of this will manifest themselves in many different ways.

I write about how humidity and moisture effects everything around us. If you would like to hear more on the impact of moisture, various topics on moisture and humidity are discussed in my eBook “A Wetter Look At Climate Change”.

Covid viral droplet

Covid Droplets in the Air

Little did I know that my Coughs and Sneezes Spreads Moisture article, written pre-pandemic, would become so relevant for so many people. Out of sheer annoyance I wrote the article because somebody sneezing on a bus in Edinburgh caused me to bring a cold virus back to Ireland giving me several days of suffering.

This post is about the droplets we exhale, by sneezing, coughing, talking and even simply breathing, that can transmit Covid through the air to infect another person. If you’d like evidence of creating airborne droplets by just simply breathing, walk outside on a really cold morning and see your breath materialise into a cloud of droplets. Watch how they disperse and disappear. So, what has happened and why is this important in spreading Covid?

The mist you see appearing from your breath is made up of millions of water droplets. These quickly spread out and evaporate in the air causing them to get smaller and smaller until they are no longer visible. When we sneeze and cough a lot more fluid is expelled as heavier droplets which are acted upon by gravity and fall to the ground, or onto any nearby surface.

Now let’s think about what these droplets contain. If what we breathe out was pure water, the droplets would evaporate to water vapour becoming part of the moisture in the air. Expelled larger droplets from a cough or sneeze contain bodily fluids and tissue (cells) and this changes what can happen to them. Instead of evaporating away, the water in the droplets, when at higher relative humidity (%RH), is not lost as quickly or even at all. This last fact is key to understanding Covid indoor transmission.

Keeping in mind droplet size and %RH being linked with the spread of Covid, let’s look at winter. A physical property of water is that the maximum amount of water the air can hold depends on temperature. When the temperature is high, as in summer, the air can carry a lot more moisture. But in cold winter conditions the air quickly becomes saturated with moisture. We breathe out on a cold morning and our warm moist breath hits a sudden temperature drop and, like dew on grass, the moisture condenses to water droplets.

We are advised to open a window to let out Covid. This makes sense as Covid virus particles (‘viral droplets’) breathed out when indoors can continually build up in the enclosed space. Potentially the situation gets worse in winter. Cold outside air comes into a heated building and is warmed. This reduces the %RH of the air making it drier. Low %RH air causes our expelled larger droplets to evaporate faster reducing their size. As the larger droplets turn into very small ones they can float around in the air for several hours. In the light of this, opening windows for fresh air circulation becomes a good idea for evacuating these small viral droplets out of the house.

Research on Covid is showing that indoor infection rates drop off quickly at 75 %RH and above. At this humidity, viral droplets can increase in volume by water absorption from the air (the opposite of drying) and makes the droplets heavier. Their movement then throughout the air is restricted by the pull of gravity shortening the time they are available to be breathed in. The drop off at 75 %RH is not a lower limit as there is a trend of decreasing infection rate from about 40 %RH upwards. It is being suggested that offices and public places should be controlled by humidification/dehumidification in the zone of 40 to 60 %RH, not just for comfort, but now also for safety. However, at higher humidity the droplets will remain droplets for longer as they resist drying out. Contact by touching a surface with viral droplets is another route for infection so hand sanitation is critical also.

Martin Byrne is somebody I’ve known for many years. His company, Envirosafe Ireland, sells containment technology. Last week, Martin shared a post on LinkedIn which was quite timely with me starting to think about writing this article. Martin’s post was a link to an article on removing airborne virus using filters in wards at Addenbrooke’s Hospital, Cambridge, UK. In this article it says “..during the first week prior to the air filter being activated, the researchers were able to detect SARS-CoV-2 on all sampling days. Once the air filter was switched on and run continuously, the team were unable to detect SARS-CoV-2 on any of the five testing days. They then switched off the machine and repeated the sampling – once again, they were able to detect SARS-CoV-2 on three of the five sampling days.” My impression of hospitals is that they are always too hot and dry, so it seems like one effective way of controlling Covid is to have airborne viral droplets filtered out of the air.

Science and technology give us hope as we gain both greater understanding of Covid infection and new tools in the fight against this highly infections and dangerous virus. But a big part of the battle is for us to take personal responsibly to protect ourselves and our fellow humans. Common sense, that rare commodity these days, would go a long way to help.

I write about how humidity and moisture effects everything around us. If you would like to hear more on the impact of moisture, various topics on moisture and humidity are discussed in my eBook “A Wetter Look At Climate Change”.

The Frizzing Humidity

Here’s a problem I do not lose any sleep over, Frizzy Hair! So why am I talking about it? Humidity of course. Somebody tweeted something like “Is this the most amazing product for frizzy hair in high humidity……”  I actually thought it was a joke! Some sort of pretend science marketing ploy. Curiosity got to me and I looked up the “product”, which was not an actual product, but an ingredient with a name abbreviated to OFPMA.……..

Powdery Mildew – An Experiment in its Control

I am getting a bit worried about the current weather. Staying with a gardening theme and fungi, we are having the type of weather that these microbes love. Days of showers and not enough sunshine to dry the ground. On top of that, the night time temperatures are sitting around about 11 to 13 centigrade. Very mild, damp and favourable for certain types of fungi. In my last post on this blog I talked about the fungi responsible for “damping off” by attacking young plants. This time my focus is on another troublesome fungi that attacks both mature and young plants, the dreaded “Mildew”.……..

Not always good to be cool, if you’re an egg!

Egg container

Hen container for eggs

I’m back to blogging after a short time away in Edinburgh. It was a few days of mixed emotions. I gave the eulogy at my mother’s funeral on Friday the 11th of March then two days later watched Scotland beat France in a great victory at Murrayfield. Returning to Ireland and checking my rainfall meter, showed that there was no rain whilst I was away. We’ve not had any rain since, which makes it 14 days rain free and a welcome break from all the wet weather of the past 3 months. Easter is arriving this weekend and thinking of eggs, I thought a few ‘foustie’ ones would be of interest. A dilemma I had was on which article to post first. This one about eggs, or, my previous one on chickens.

Weather – is it getting wetter?

Rain Gauge in Garden

Rain Gauge – 25 mm rain = 1 inch

Two years ago this week (11th Feb 2014) I wrote an article on the extreme weather in the UK causing the worst floods “in living memory”. A commentator in the media made a point about the rain being in the wrong place at the wrong time. What he meant was, if the same amount of rain had steadily fallen in the mountains and filled the reservoirs, that would have helped with the managed water supply. Instead we saw flash flooding affecting built up areas and causing immense, and such painful, grief for lots of people.

Out of my own interest in rainfall I put my local rainfall data for Nov, Dec and Jan for the years 2009 – 2014 onto a chart. It showed the Total rainfall in each month fluctuated as expected but there was no dramatic increase in the overall volume that fell. I have just done another chart showing the monthly and total rainfall to include the past three months and the story is now different.…

Buzzing around moisture

A few years ago when researching the world of moisture for ideas to include in my book A Wet Look At Climate Change I came across a paper published in the Journal of Insect Physiology talking about honey bees and humidity. I filed this away as “interesting” but didn’t think about it much further. Last year just before spring I got interested in bees again. Nothing to do with moisture this time, just a liking for bees buzzing around the garden. It may have been something on Twitter, but one thing led to another, and I found myself contacting the National Biodiversity Data Centre in Waterford. However, as always with me, moisture had to come into the story at some point….

What’s Green, Slippery and Dangerous?

That could be the start of a kid’s playground joke. If it is I cannot find the punchline. Actually, it’s not a joke, it’s something that can have quite serious consequences.

Alphabet Weather

Wild, wild weather!

Umbrella and weather

U is for……?

Heinz alphabet spaghetti, a distant memory from my youth and something that just popped into mind when watching yesterday’s wild, wild weather.

Strange connection to make between these two you may think? Not in my brain!

To give you a clue, what’s the connection between Desmond, Abigail, Clodagh, Frank, Eva and Barney?

Powered by WordPress & Theme by Anders Norén