My World of Moisture

Tag: Climate

A Perception of Local Climate Change

My local climate has definitely changed. Not only does it seem that it has, which is just a feeling, but also supported by other people saying the same thing. There is in addition to this, evidence in the way plants are starting their growing season much earlier. Our rhubarb is already big enough to pick and we still have plenty in the freezer from last year because it grew so well. I thought maybe it was a good time to pull together the rainfall data I’ve collected over the years and have a look to see if the weather is truly wetter.

In February 2016 I wrote an article “Weather – Is it getting wetter?” and that followed on from an article I wrote on the extreme weather in the UK causing the worst floods “in living memory” in 2015. My rainfall data at that point did show an upward trend over 2010 to 2015 indicating that the weather could be getting wetter. A caveat I included in the article was that the timescale was very limited for monitoring climate change. Would my rainfall data now spanning 12 years tell the same story? Well, let’s find out.

I’ll start with a graph because people like graphs.
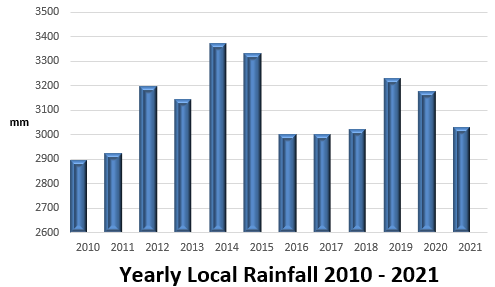
This graph shows the total from each year by adding up all the rain from individual days. When I wrote my article on rainfall at the beginning of 2016, you can see from the trend going from 2010 to 2015 why I thought we were getting more rain than usual. But then look what happens. Over the next three years, 2016 to 2018, we had lower rainfall and all about the same amount. In the past three years we see a wetter one in 2019, followed by decreasing amounts with 2021 coming down to 2016 to 2018 levels.

So now we have a bit of dilemma in that the data do not match our recent perception of the climate as getting wetter. Perhaps looking at the monthly rainfall might reveal something.

In each year the graph shows rainfall per month going from January to December. The pattern of rainfall just looks like “noise” with no obvious trend. One outstanding month is December 2015 when we had an awful lot of rain. This is probably what led me to writing my first post on rainfall in January 2016.

Still on the hunt for an explanation to our perception of a wetter climate, the next step to take is to drill down in the data to daily rainfall. Playing around with plotting in Excel I came up with the next graph.
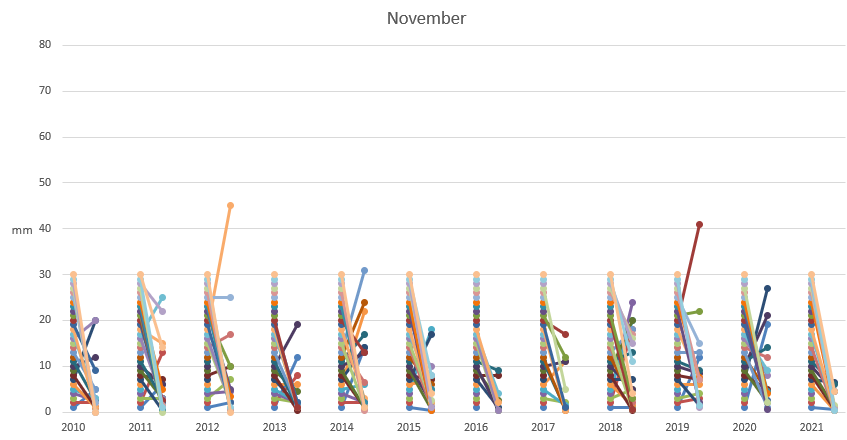
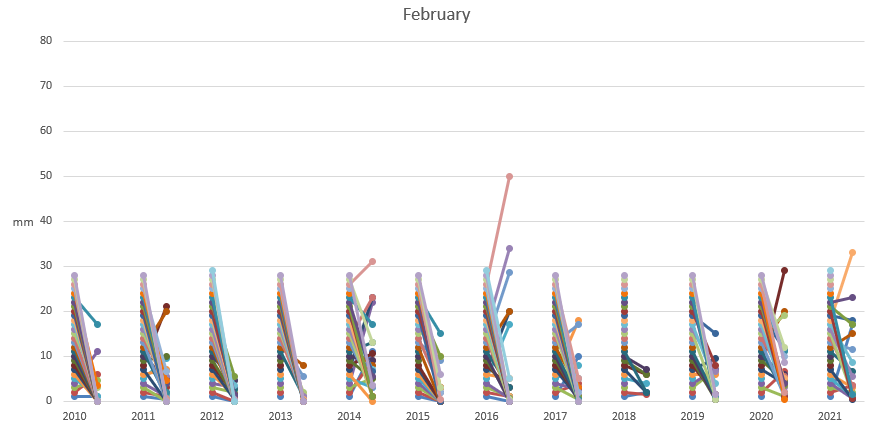
The right hand column of coloured dots for each year is the day of the month, 1 to 30 for November. Each of these dots is linked by a line to the amount of rainfall on that day. By showing the data in this way it is easy to see on which days the rain was heaviest. Again, as we saw above for the yearly and monthly rainfall, there is nothing that jumps out at you as a pattern for change to a wetter climate.
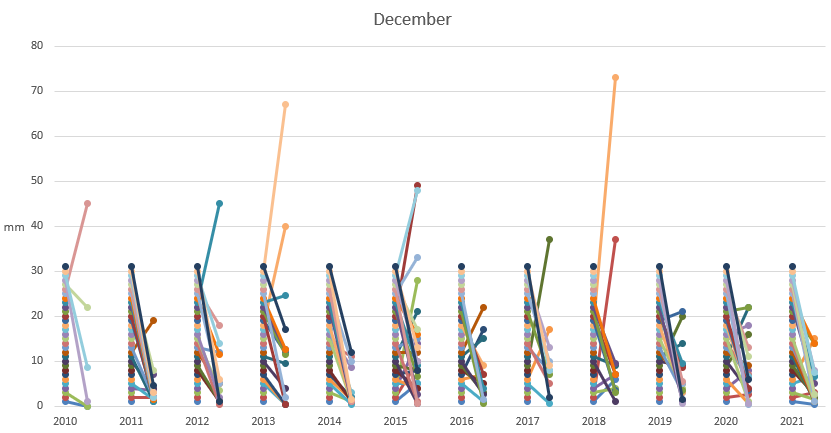
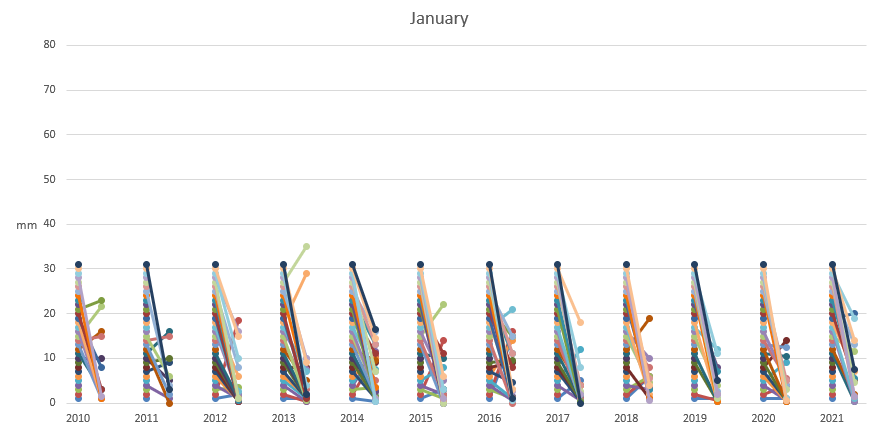
Comparing the normally wetter winter months, November to February, a sequence of weather seems to be generally consistent. November and February are similar in having some dryish years and some very wet years. January is the driest of the winter months and clearly December is the month to expect days with really heavy rainfall. The very large amount of rain on one day in December 2018 was due to Storm Deidre and reported as follows on the Met Eireann website:

High pressure established itself over Scandinavia on the 12th and the airflow over Ireland backed to south or southeast up to the 15th. The bulk of the rain during this period fell in the South. On the 15th, Storm Deirdre deepened rapidly as it moved across the country giving widespread heavy rain and very strong winds

A similarly heavy day’s rain you can see in December 2013 was another winter storm, but in this case, unnamed as this was before the practice of naming storms.

Having gone through this analysis of my local rainfall data I have eliminated an increase in rainfall as a reason for our perception of a wetter climate. I want to emphasise here the word “local” because clearly other parts of Ireland and the British Isles generally have seen record amounts of rainfall leading to flooding in places where people cannot remember doing so in “living memory”.

Two observations from recent years, particularly 2021, have directed my thinking about this perception of a wetter climate. From August to the end of that year any heavy and persistent rain caused our lawn to partially flood.  Despite us taking measures to reduce the amount of run-off rain onto the lawn, parts were still flooding. Speaking with somebody who had spent Christmas 2021 with his mother in England, said he had also seen flooding on his mother’s lawn that he could not remember happing before.

The second observation is that the relative humidity readings (%RH) from our weather station seemed to remain high all year, including over the summer. These readings are not recorded for reasons I’ll not go into here, but it is to do with a technical matter around Davis weather stations and the difficulty of interpreting historical humidity data..

My hypothesis based on these observations is that persistent high humidity has reduced evaporation of water from the soil. To understand the link between %RH and evaporation, have a read of the technical section of my eBook “A Wetter Look At Climate Change” and particularly the chapter in which I talk about not being able to dry your clothes on a damp day.

If the amount of water evaporating from the soil is reduced, then the water table remains higher than normal. So, after some very heavy showers or persistent heavy rain over a couple of hours, the water table is quickly topped up to the level of the soil surface. Today, the 9th March, is one of those days. Met Eireann has issued a yellow status wind and rain warning from earlier this morning and our lawn is flooding. As are parts of a gravel path and I cannot get to my car without paddling through a large puddle!

The overall impact of having continuous high humidity, seeing parts of the ground flooding and slow to dry, has, I think, led to our perception of a wetter local climate. No doubt, and Nature is showing us, the Earth’s climate is warmer and that will in itself lead to more moisture in the air. Consequences of this will manifest themselves in many different ways.

I write about how humidity and moisture effects everything around us. If you would like to hear more on the impact of moisture, various topics on moisture and humidity are discussed in my eBook “A Wetter Look At Climate Change”.

The Humidistat

I ended 2021 by sharing a climate change article on LinkedIn. This article concluded with a call to action to become part of the global warming solution and not just whinge about the problem. Now I’m starting 2022 with my own article concerning climate change and what we are doing at home to be part of the solution in our own little way. As events unfolded, and during a discussion with a salesperson, the title for this article “The Humidistat” occurred to me.

Solar panels for us?

Our story begins with one of those emails that are usually ignored. It said that the Irish Government grants for installing solar panels were coming to an end soon. Maybe a good marketing ploy by Active8 Solar Energies, but it was something that had crossed the mind several times over the past few years. After checking Active8 out we booked a home visit to see if our old bungalow was even suitable for solar panels. Fair play to the person taking the call at Active8 as they said the SEAI grant was due to end but had been extended. So, that meant the time pressure was off and we need not rush into something without due consideration.

A good thing about dealing with electricity suppliers online these days is that you can get summaries of your usage. By the time Jerry Cropley the Active8 salesperson turned up at the front door with mask on, I was armed with my annual kWp, the number of panels needed and the cost per panel. Jerry, who was very knowledgeable and helpful answering our solar energy questions, assessed our bungalow to be suitably located (not overshadowed), very good with its south facing, low (30%) pitched roof and type of tiles. The cost was calculated and came in much lower than I’d thought. I was starting to feel good about our potential part in a climate change solution. Signatures added on an electronic notebook and all that was then required was a BER (Building Energy Rating) certification that was inclusive in the cost.

Cavity wall insulation

From many years of involvement in projects, one of the cost-saving measures we watch out for are things that have a tendency to grow ‘arms and legs’ – ramping up the cost. Well, we failed the BER! Of the options presented to us for upping our rating, cavity wall insulation seemed the best. Again, something that we had considered in the past to save energy. At what cost though?

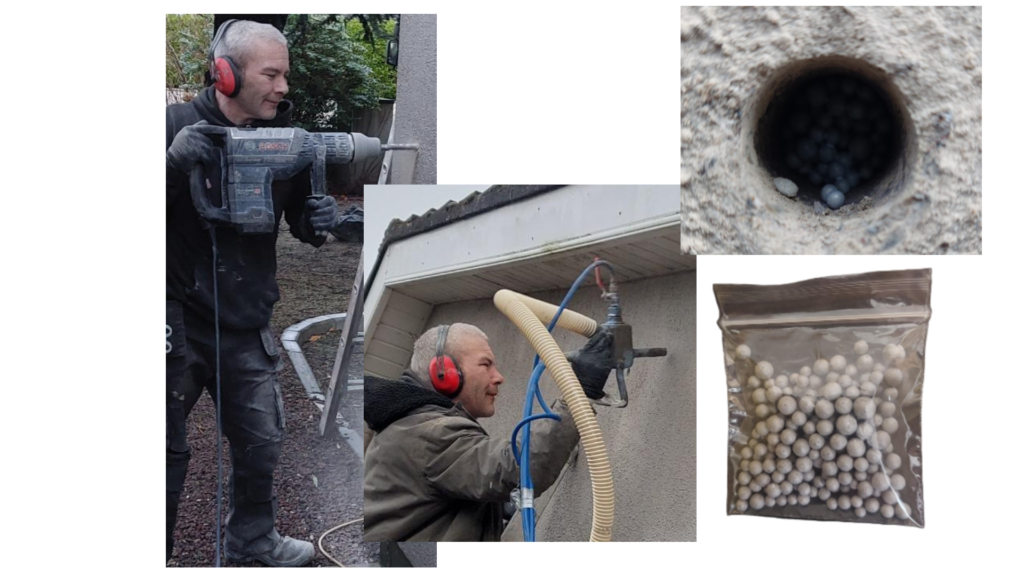
Luckily, we have a local company, Dungarvan Insulation, that does a range of options for insulation. A quick call led to Dave O’Connor coming round in a couple of days, who measured the walls, asked a few questions about the inside of the walls, dry lining was one. Dungarvan Insulation make their own thermobeads for filling the wall cavity, something that appealed to me in a company having that expert knowledge. Raw material for the thermobeads arrives in Dungarvan as a dense powder then steam is used to swell the material to form expanded beads.

Humidity and extractor fans

Dave and I had a great wee chat about humidity. We talked about movement of air in rooms and through buildings. Also, the various options that are offered as solutions to where moisture builds up. Care has to taken that when thinking about insulation options you don’t seal off ventilation causing humidity to build up. Our conversation led into removing high humidity using through-the-wall extractor fans. Moving our chat onto “smart” options, home extractor fans can have humidity control built-in. When the %RH reaches a specified humidity, the fan automatically switches on or off, saving energy from running when not needed. To control this electronically the extractor fan must have a microchip called “The Humidistat”.

After pivoting into My World of Moisture with Dave, back to the all important question: what is the cost?  The answer is surprisingly reasonable. About the cost of an international holiday with a long haul flight. In the current circumstances particularly, we are going nowhere and happy to forego a holiday abroad and save contributing to burning aviation fuel. This was on 20th Dec and now it’s the 10th of January and Mark arrived in a large lorry filled with 80-100 m3 of thermobeads at 8am and finished at noon. Pretty good service I’d say.

Humidistats

Now we’ve reached a good point to suspend my solar panel story until they are installed. Let’s explore The Humidistat. First what does it look like? In the picture I’ve labelled the key parts of a humidistat microchip. This one is made by Honeywell, one of many suppliers of humidistats and they come in various shapes and sizes. To give you some perspective, the one in the picture is about 5mm x 4mm x 2mm. They can be bought up to 1000 chips on a tape. A machine for pick-and place can lift the humidistats from a tape and place them on printed circuits in large numbers, or you can pick off the humidistats yourself and solder the chip by its pins to the copper lines on a printed circuit.

The pins which are numbered 1-8, each can have a function or just used for supporting the mounting. For instance, the one in the picture has Pin 7 designated as “NC” (not for external connection). Voltage in and out is “Pinouts” 1 and 2 in the picture, whereas 5 and 6 are the high and low humidity outputs. Adjustors on an extractor fan fitted with a humidistat allow you to set the humidity range, for example, 60 %RH to 80 %RH. The electronics controlling the switch for the fan reads the output from the humidistat and turns it on at 80 %RH and then off at 60 %RH.

Concerning condensation

The type of humidistat shown in the picture has a hydrophobic (water hating) filter, that you can see in the top of the chip and makes it condensation-resistant. Underneath the filter is a humidity sensor that responds according to the amount of moisture in the air. Water condensing on the sensor will interfere with its moisture measurement and the filter stops this happening in areas of very high humidity, as in a bathroom or shower room.

Earth, a gigantic humidistat

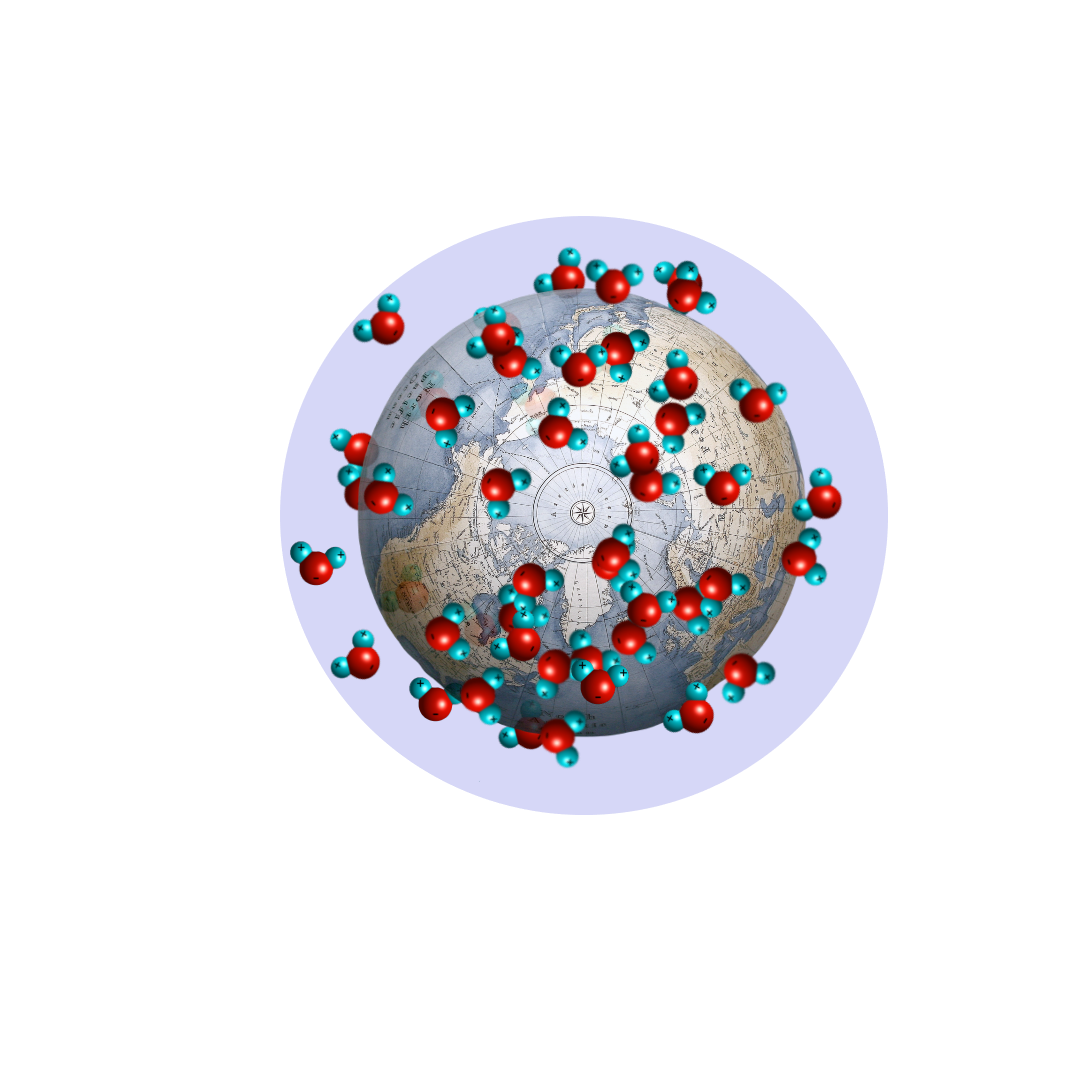
Our planet could be thought of as a gigantic humidistat with a whole load of complex inputs and outputs that has kept the climate fairly steady over thousands of years since the last ice age. We are now seeing a change in that balance of the climate through what we think is a result of hundreds of years of human activity and in particular the industrial revolution. Global warming is heating up the atmosphere and driving more moisture into the air causing a change in our climate, that’s a fact.

I explain the relationship between temperature and humidity in my eBook “A Wetter Look At Climate Change” and talk about the source of extreme weather. Unfortunately for us when it comes to our global humidistat, unlike the microchip, there is no adjuster control for us to set the humidity!

Simply bananas

To finish on a lighter and more positive note. One of our local supermarkets has made a commitment to sustainability and reducing plastic packing. Bananas packed in plastic bags are no longer being put on the shelves. Instead, here’s a picture of the new presentation of their bananas. This appeals to my quirky sense of humour, I’m not going to explain why, just leave it for you to enjoy.

I write about how humidity and moisture effects everything around us. If you would like to hear more on the impact of moisture, various topics on moisture and humidity are discussed in my eBook “A Wetter Look At Climate Change”.

The eBook, The Bad and The Nice

A mixed bag of things to talk about. An article about my eBook A Wet Look At Climate Change, a fungus called rust, and what we did with a glut of runner beans and courgettes.

Toe nail infection – how I cured mine

Fungal infection in toe nails

My infected toe nails

Naturally at this time of year most of us keep our feet covered. Shoes or boots on when outside (even frequent use of wellies with the current weather conditions) and maybe slipper socks or slippers on inside. When our feet are enclosed for long periods, moisture builds up and this creates a warm moist environment where fungi can thrive. With the mild wet weather we have had this winter and the almost constant high humidity, it would be no surprise if the incidence of fungal infections is higher this year. Three years ago I got a fungal infection in several toe nails. Faced with some limited options here’s what I did…

Buzzing around moisture

A few years ago when researching the world of moisture for ideas to include in my book A Wet Look At Climate Change I came across a paper published in the Journal of Insect Physiology talking about honey bees and humidity. I filed this away as “interesting” but didn’t think about it much further. Last year just before spring I got interested in bees again. Nothing to do with moisture this time, just a liking for bees buzzing around the garden. It may have been something on Twitter, but one thing led to another, and I found myself contacting the National Biodiversity Data Centre in Waterford. However, as always with me, moisture had to come into the story at some point….

What’s Green, Slippery and Dangerous?

That could be the start of a kid’s playground joke. If it is I cannot find the punchline. Actually, it’s not a joke, it’s something that can have quite serious consequences.

Alphabet Weather

Wild, wild weather!

Umbrella and weather

U is for……?

Heinz alphabet spaghetti, a distant memory from my youth and something that just popped into mind when watching yesterday’s wild, wild weather.

Strange connection to make between these two you may think? Not in my brain!

To give you a clue, what’s the connection between Desmond, Abigail, Clodagh, Frank, Eva and Barney?

Powered by WordPress & Theme by Anders Norén